No Place
To
Call home.
data visualization design
Data Source: US Department of Housing and Urban Development
Project Type: Data visualization
Role: Data Collection, Visualization Design
Duration: 2 weeks
Tool Used: Excel, Illustrator
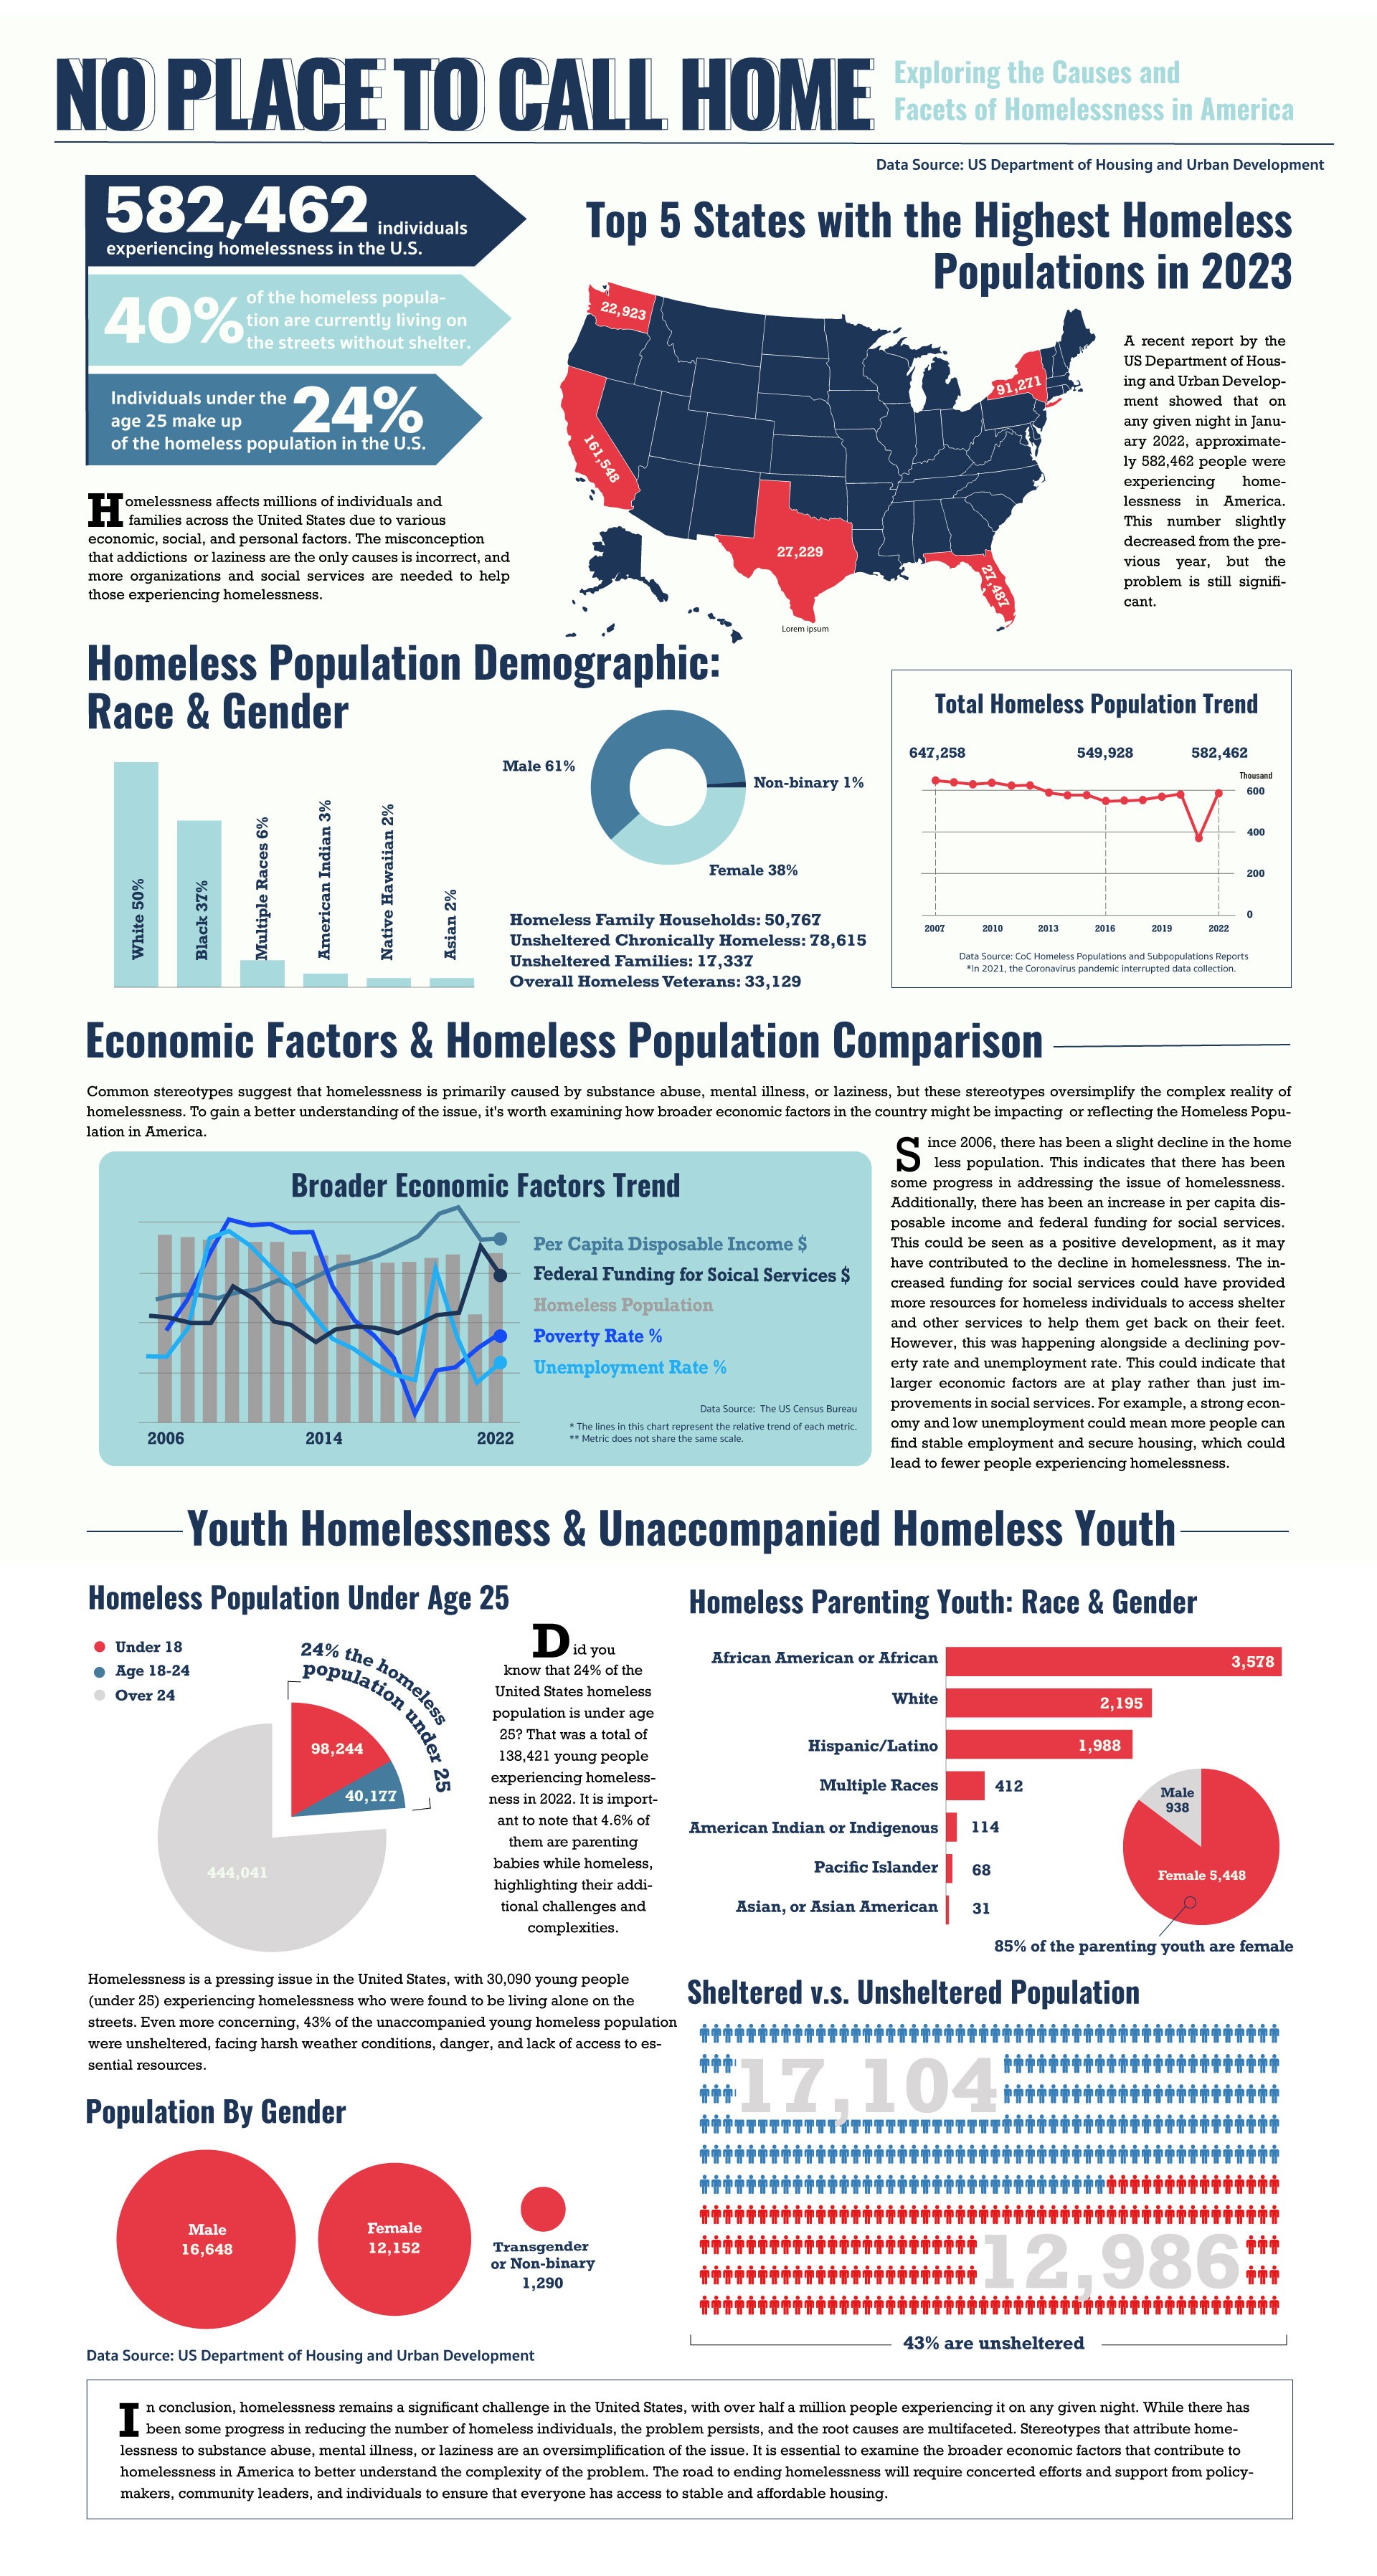
A recent report by the US Department of Housing and Urban Development showed that on any given night in January 2022, approximately 582,462 people were experiencing homelessness in America. This number slightly decreased from the previous year, but the problem is still significant.

161,548
22,923
27,229
27,487
91,271
Top 5 States with the Highest Homeless Populations in 2023
Homelessness affects millions of individuals and families across the United States due to various economic, social, and personal factors. The misconception that addictions or laziness are the only causes is incorrect, and more organizations and social services are needed to help those experiencing homelessness.

Deeply concerned about the homeless problem in the states, I selected this topic for my first data visualization project. I began by collecting data from diverse sources and meticulously cleaned and preprocessed it to maintain integrity. Subsequently, I applied analysis techniques to extract insights, which informed my selection of suitable visualization designs.

Photo by Matt Collamer on Unsplash
Project Objectives
This project aims to shed light on the multifaceted issue of homelessness, dispelling common misconceptions and advocating for increased awareness and support. By harnessing the power of data visualization, I seek to deliver a compelling narrative that underscores the urgency of addressing this pressing societal challenge.
Here are the questions I aim to address:
How do recent social developments contribute to rising homelessness?
What are the demographic characteristics of the homeless population, and are they sheltered or unsheltered?
Which states have the highest homeless populations, and how sufficient are the support services there?
Which states offer the most suitable outdoor living conditions for homeless individuals?
Data Resources
Point-in-Time Estimates by CoC(2007 - 2022): Provides comprehensive data on homeless populations over sixteen years, including demographic breakdowns and shelter status.
IBIS World: Offers insights into social and economic factors influencing homelessness trends, such as unemployment rates, poverty levels, and federal funding for social services.
Federal Budget for Homelessness: Provides insights into government initiatives and funding allocations aimed at addressing homelessness.
HUD 2022 Continuum of Care Homeless Assistance Programs Housing Inventory Count Report: Offers information on available shelter beds across states, indicating the level of support for homeless populations.
States with the Least Natural Disasters in 2023 & Average Annual Temperature for Each U.S. State: Provides data on weather conditions to assess which states offer the most conducive outdoor environments for homeless individuals.
workflow:
Define Questions > Collect Datas > Organize and Analyze Data in Excel > Document Findings in Google Docs > Create Visualizations in AI
Final Design
work collections

